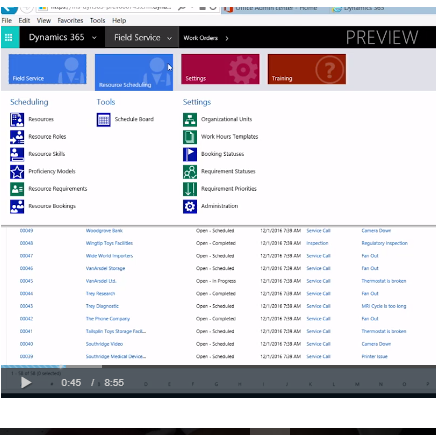
Field Service at a Glance
work order generation –> Schedule & Dispatch –> Service Delivery –> Review & Bill
Field Service Capabilities help organisations deliver to customers outstanding onsite service
> Work Oders
> Schedule Assistant
> Schedule Board
> Resource Management
> Asset Tracking
> Multi – Warehouse Inventory
>Mobile
> Geocoding
> Manage RMAs and RTVs
>> Work Oders
> Captures essence of what needs to be preformed
> Used to coordinate and schedule resource and activities
> Can be used for different types of work such as installations , repairs, or preventative maintenance
>> Smart Scheduling:
Schdule the right resource with the right equipment to the right location,
meeting SLAs and ensuring a fast first time fix.
>> Schedule Board
> Drag & drop interface for scheduling and rescheduling
> Filter by resource type services etc,,
> Scheduler settings allow configuration of dispatcher time zone, grouping etc..
>> Schedule Assistant
> Allows applying constraints to query the for resources
> Duration
> Radius
> Start & End Days
> Territory
> Resource Types
>> Resource Management
> Define Users,Equipment, Accounts, Contacts, etc.
that are used to service work orders
> Use Characteristics (skills & certifications) and category associations can be included for better scheduling.
> Manage Schedules
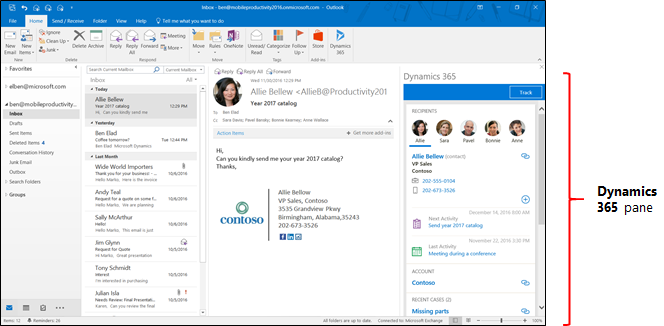
>> Mobile field enablement
> Keep your technicians nimble and in the know whether they are using a hand-held device, smartphone or laptop.