Hello Everyone,
Today I am going to share my thoughts on analysing the business impact of Copilot Studio Agents in Viva Insights.

Let’s get started.
Copilot Studio Agents integrated within Microsoft Viva Insights help organisations enhance employee productivity, well-being, and collaboration by providing AI-driven personalised recommendations and automated assistance.
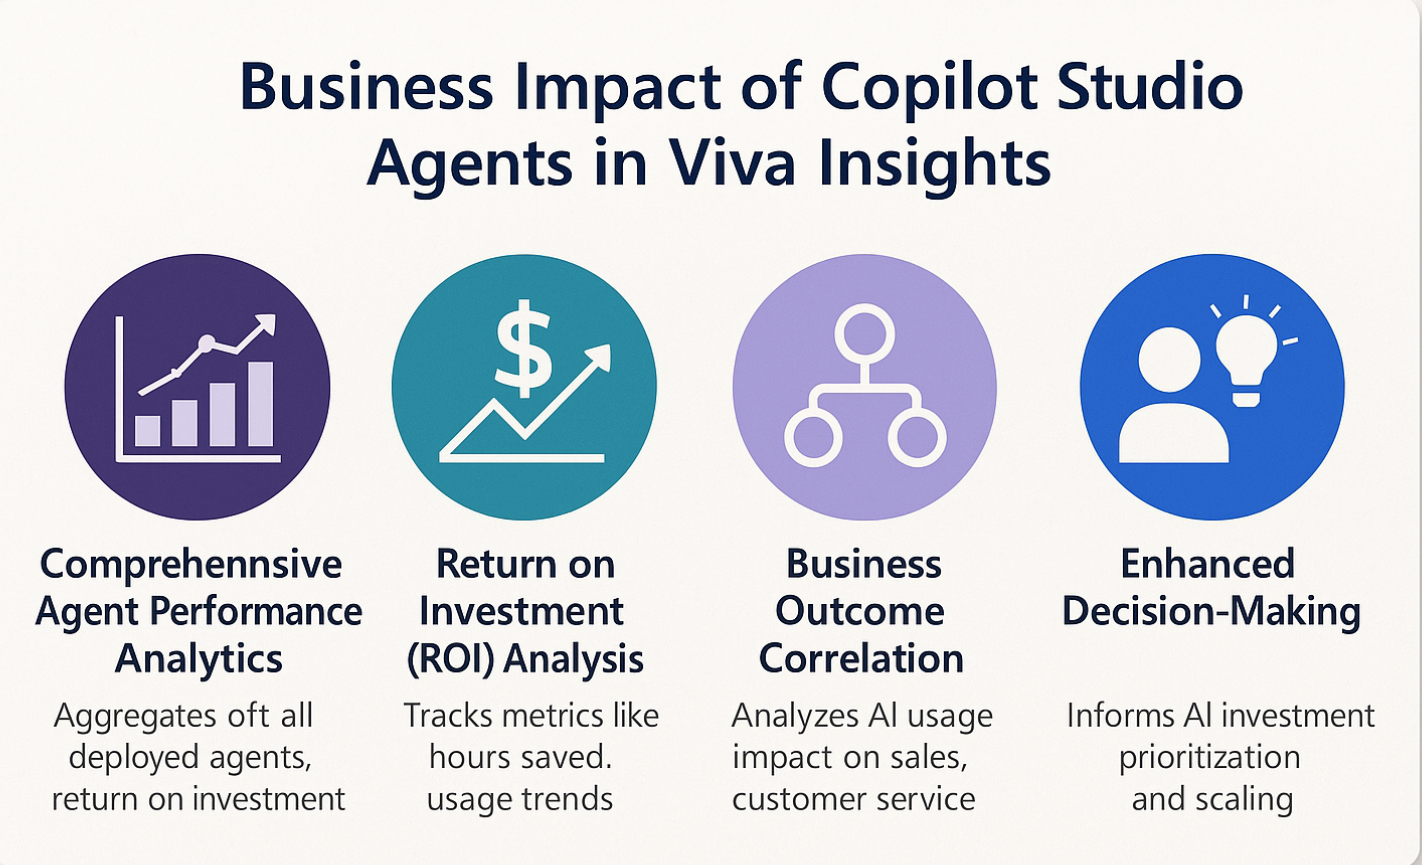
Analysing their business impact involves measuring key performance indicators such as time saved on routine tasks, improvements in employee engagement, and quality of decision making support.
Viva Insights leverages data from collaboration tools like Microsoft Teams and Outlook, enabling copilot agents to deliver actionable insights that reduce cognitive load and foster healthier work habits.
The analysis focuses on how these agents continue to increased efficiency, reduced burnout, and improve work-life balance.
Organizations can track metrics such as adoption rates, user feedback, and productivity improvements to assess the effectiveness of Copilot agents. Additionally, integrating feedback loops and sentiment analysis helps refine the AI’s assistance quality over time.
Overall evaluating Copilot Agents in Viva Insights provides a comprehensive understanding of their role in driving digital transformation, enhancing employee experience, and positively impacting organizational performance.
That’s it for today.
I hope this helps.
Malla Reddy Gurram(aka `@uk365guy)