Menu Close

Tag: #365blogpostin365days

How to switch to new Org Chart from old version on Dynamics 365 Model Driven App

Hello Everyone,

Today i am going to share how to switch to New Org chart will fully replace the old version.

Let’s get’s started.

Login into Dynamics 365 Sales

New Org Chart:

Help sellers gain a deeper understanding of account hierarchies and contact influence levels within an account.

Org Chart help you visualize the hierarchy and relationship between departments and roles in your customers organisations.

Note: Starting October 2023, the new org chart will fully replace the old version: Features includes:

Improved Experience: Now access the org chart from contacts form as well. All the contacts associated with the account will be pre-loaded into a list on the left pane. Easily drag and drop from the list to build your org chart.

Add more information: Define contact’s influence level by adding labels or by setting them as assistants.Keep track of important information by veiwing and adding seller notes.

Do more by upgrading your license: Understand the relationship health with your contacts at a glance and stay connected to them through the LinkedIn Integration.

Contact labels:

Now you can create custom labels or modify existing ones and define the label colours through the link below.

1.System administrator or similar role users can turn on org chart feature for sales managers and sellers in your organization.

2. If you have a Sales Manager, Salesperson, or similar role, you can manage org charts and view org charts.

Permissons required:

Roles other than sales managers or salespersons should have permissions to custom entities.

Custom Entities – Microsoft Orgchart node entity – Organization – Create, Write, Read, and Delete

That’s it for today.

I hope this helps

Malla Reddy Gurram(@UK365GUY)
#365BlogPostsin365Days

Share this:

{Do you know} How to add Power App to Microsoft Teams as a tab.

Hello Everyone,

Today i am going to show how to add Power App to your Microsoft Teams.

Let’s get’s started.

Suppose your Sales teams always use Dynamics 365 Sales for day to day work, and “Adding the Power App to Teams” will give a chance for your sales team to work from Microsoft Teams instead of logging into Dynamics 365 Sales Hub.

Login into www.make.powerapps.com

Select the model driven app and click on “Add to teams”.

Microsoft Teams will be opened and then select the team or channel to show this sales hub, so that it will show to your entire team as tab.

Tab will be created and save it.

Finally Sales Hub is added as a tab for your sales teams, see below.

That’s it for today.

I hope this helps.
Malla Reddy Gurram(@UK365GUY)
#365BlogPostsin365Days

Share this:

{How to} Visualize your data quickly from Power Apps and Dynamics 365 Apps

Hello Everyone,

Today i am going to show how to visualize your data quickly from Power Apps and Dynamics 365 Apps.

Let’s get’s started.

If you want to know how to enable the Visualize a view on Model Driven App read my previous before this blog post.

Now we are going to see how we can visualize the data just like in Power BI Service,
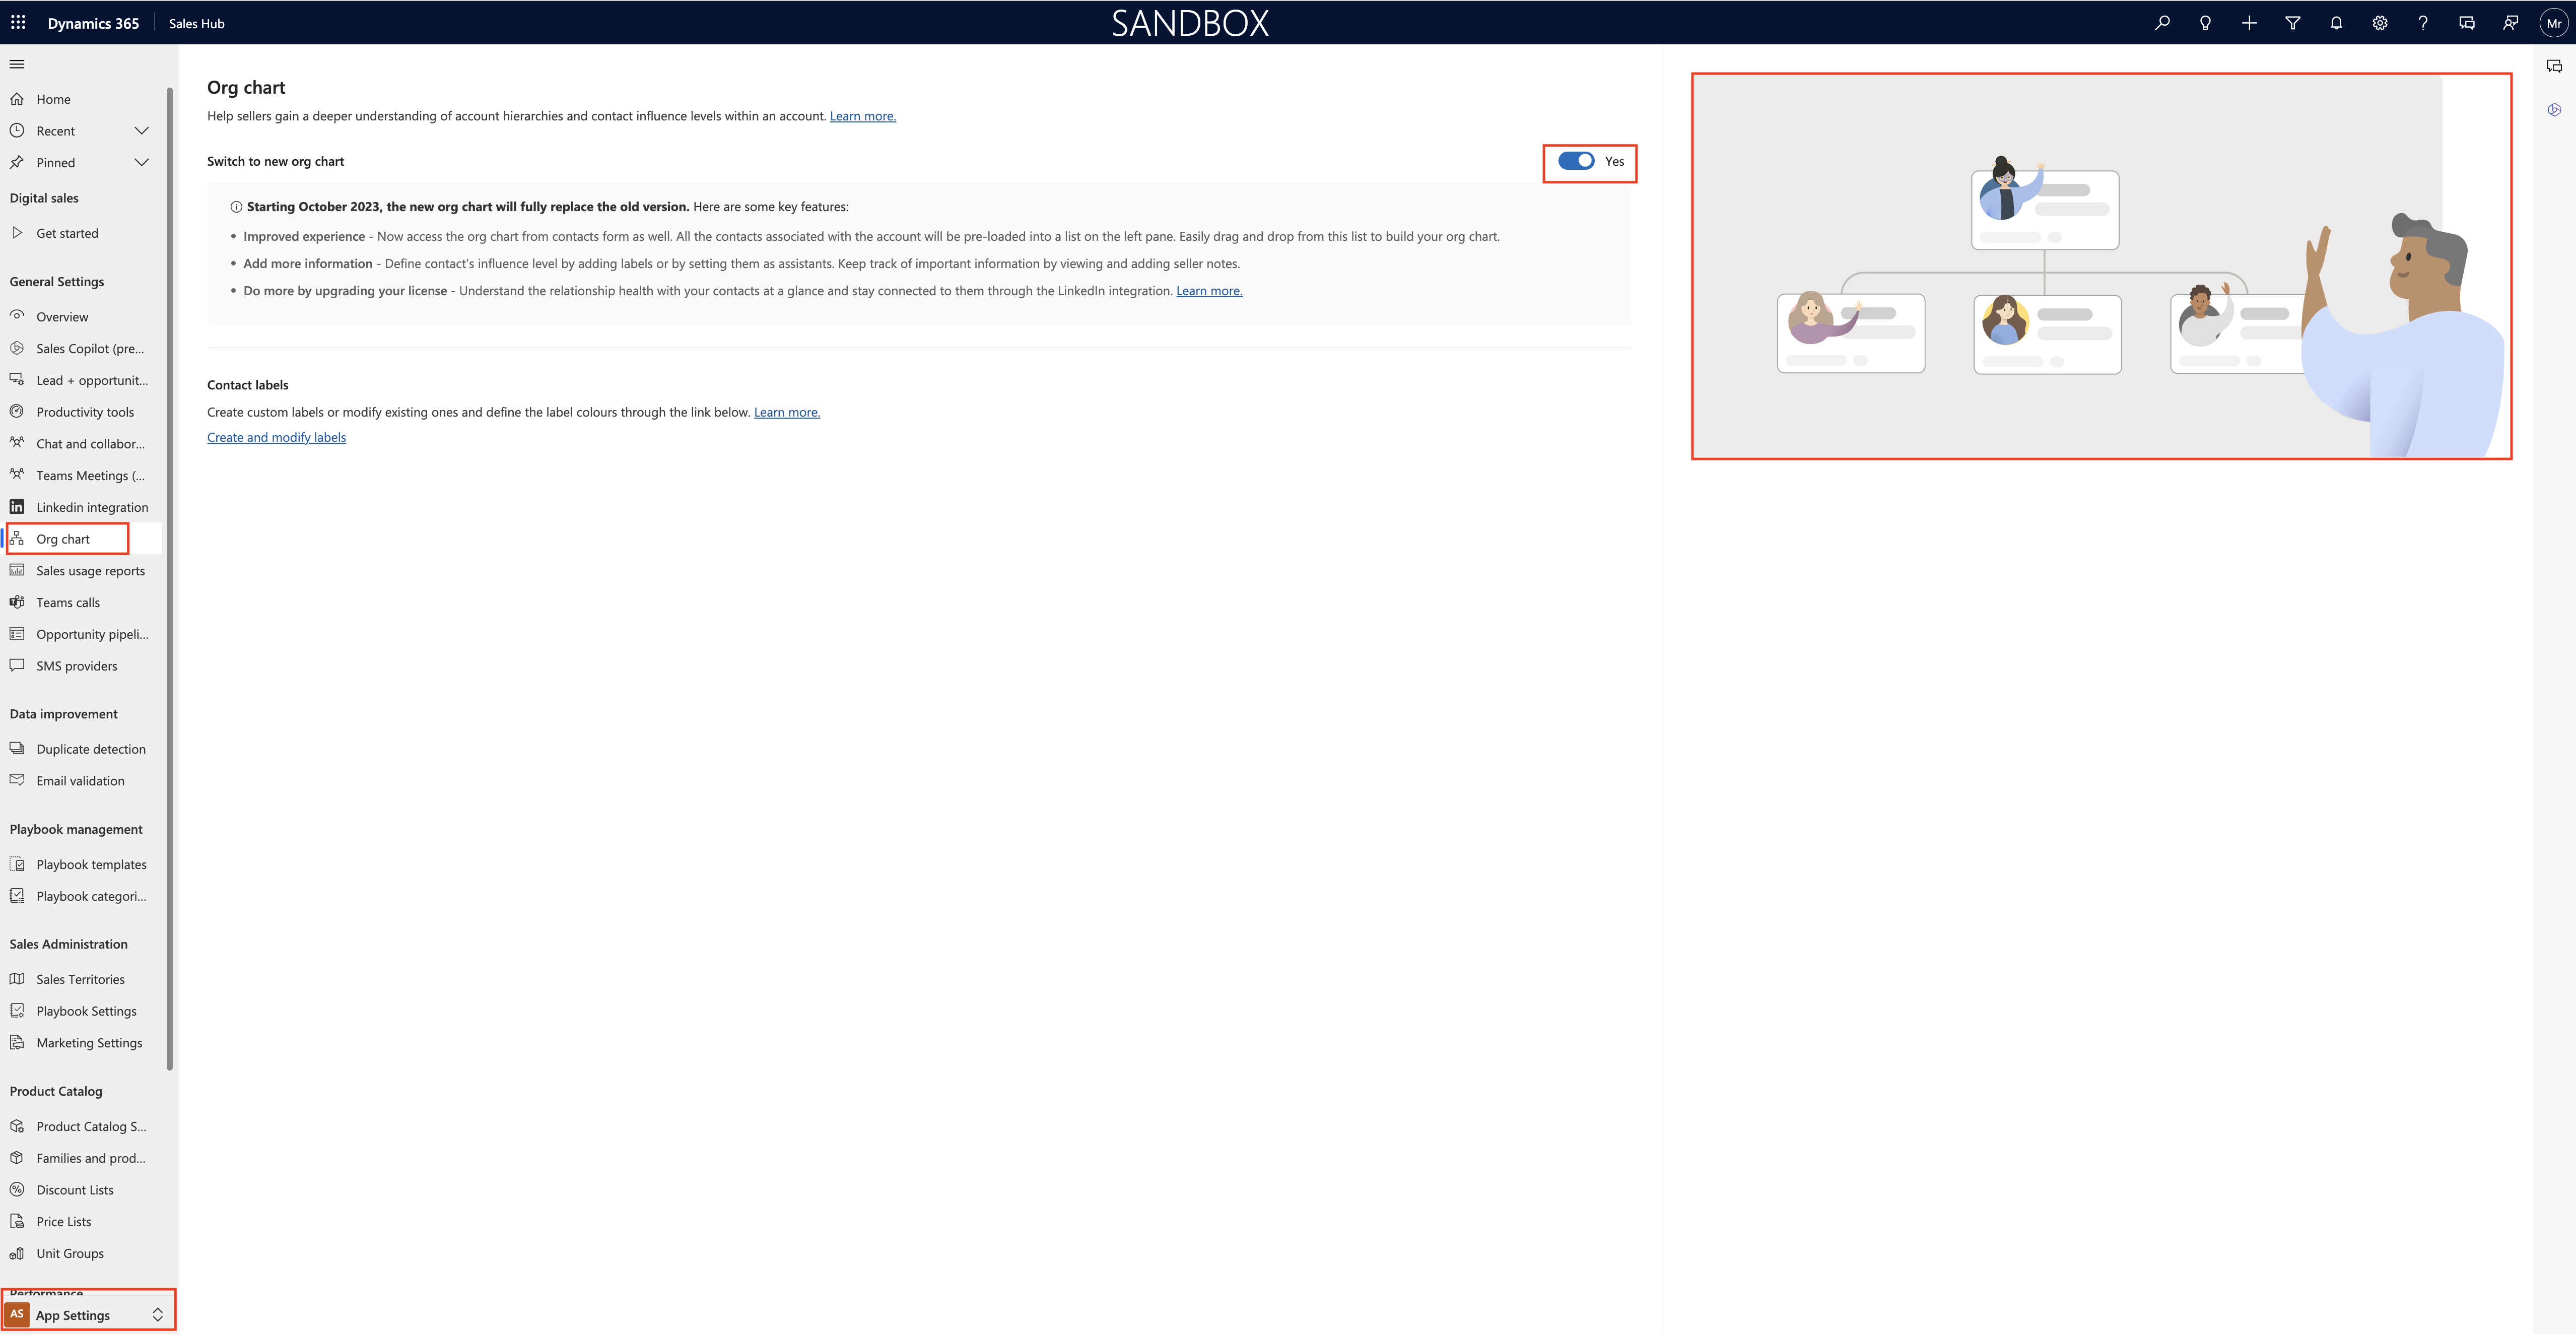
Visualize a view:

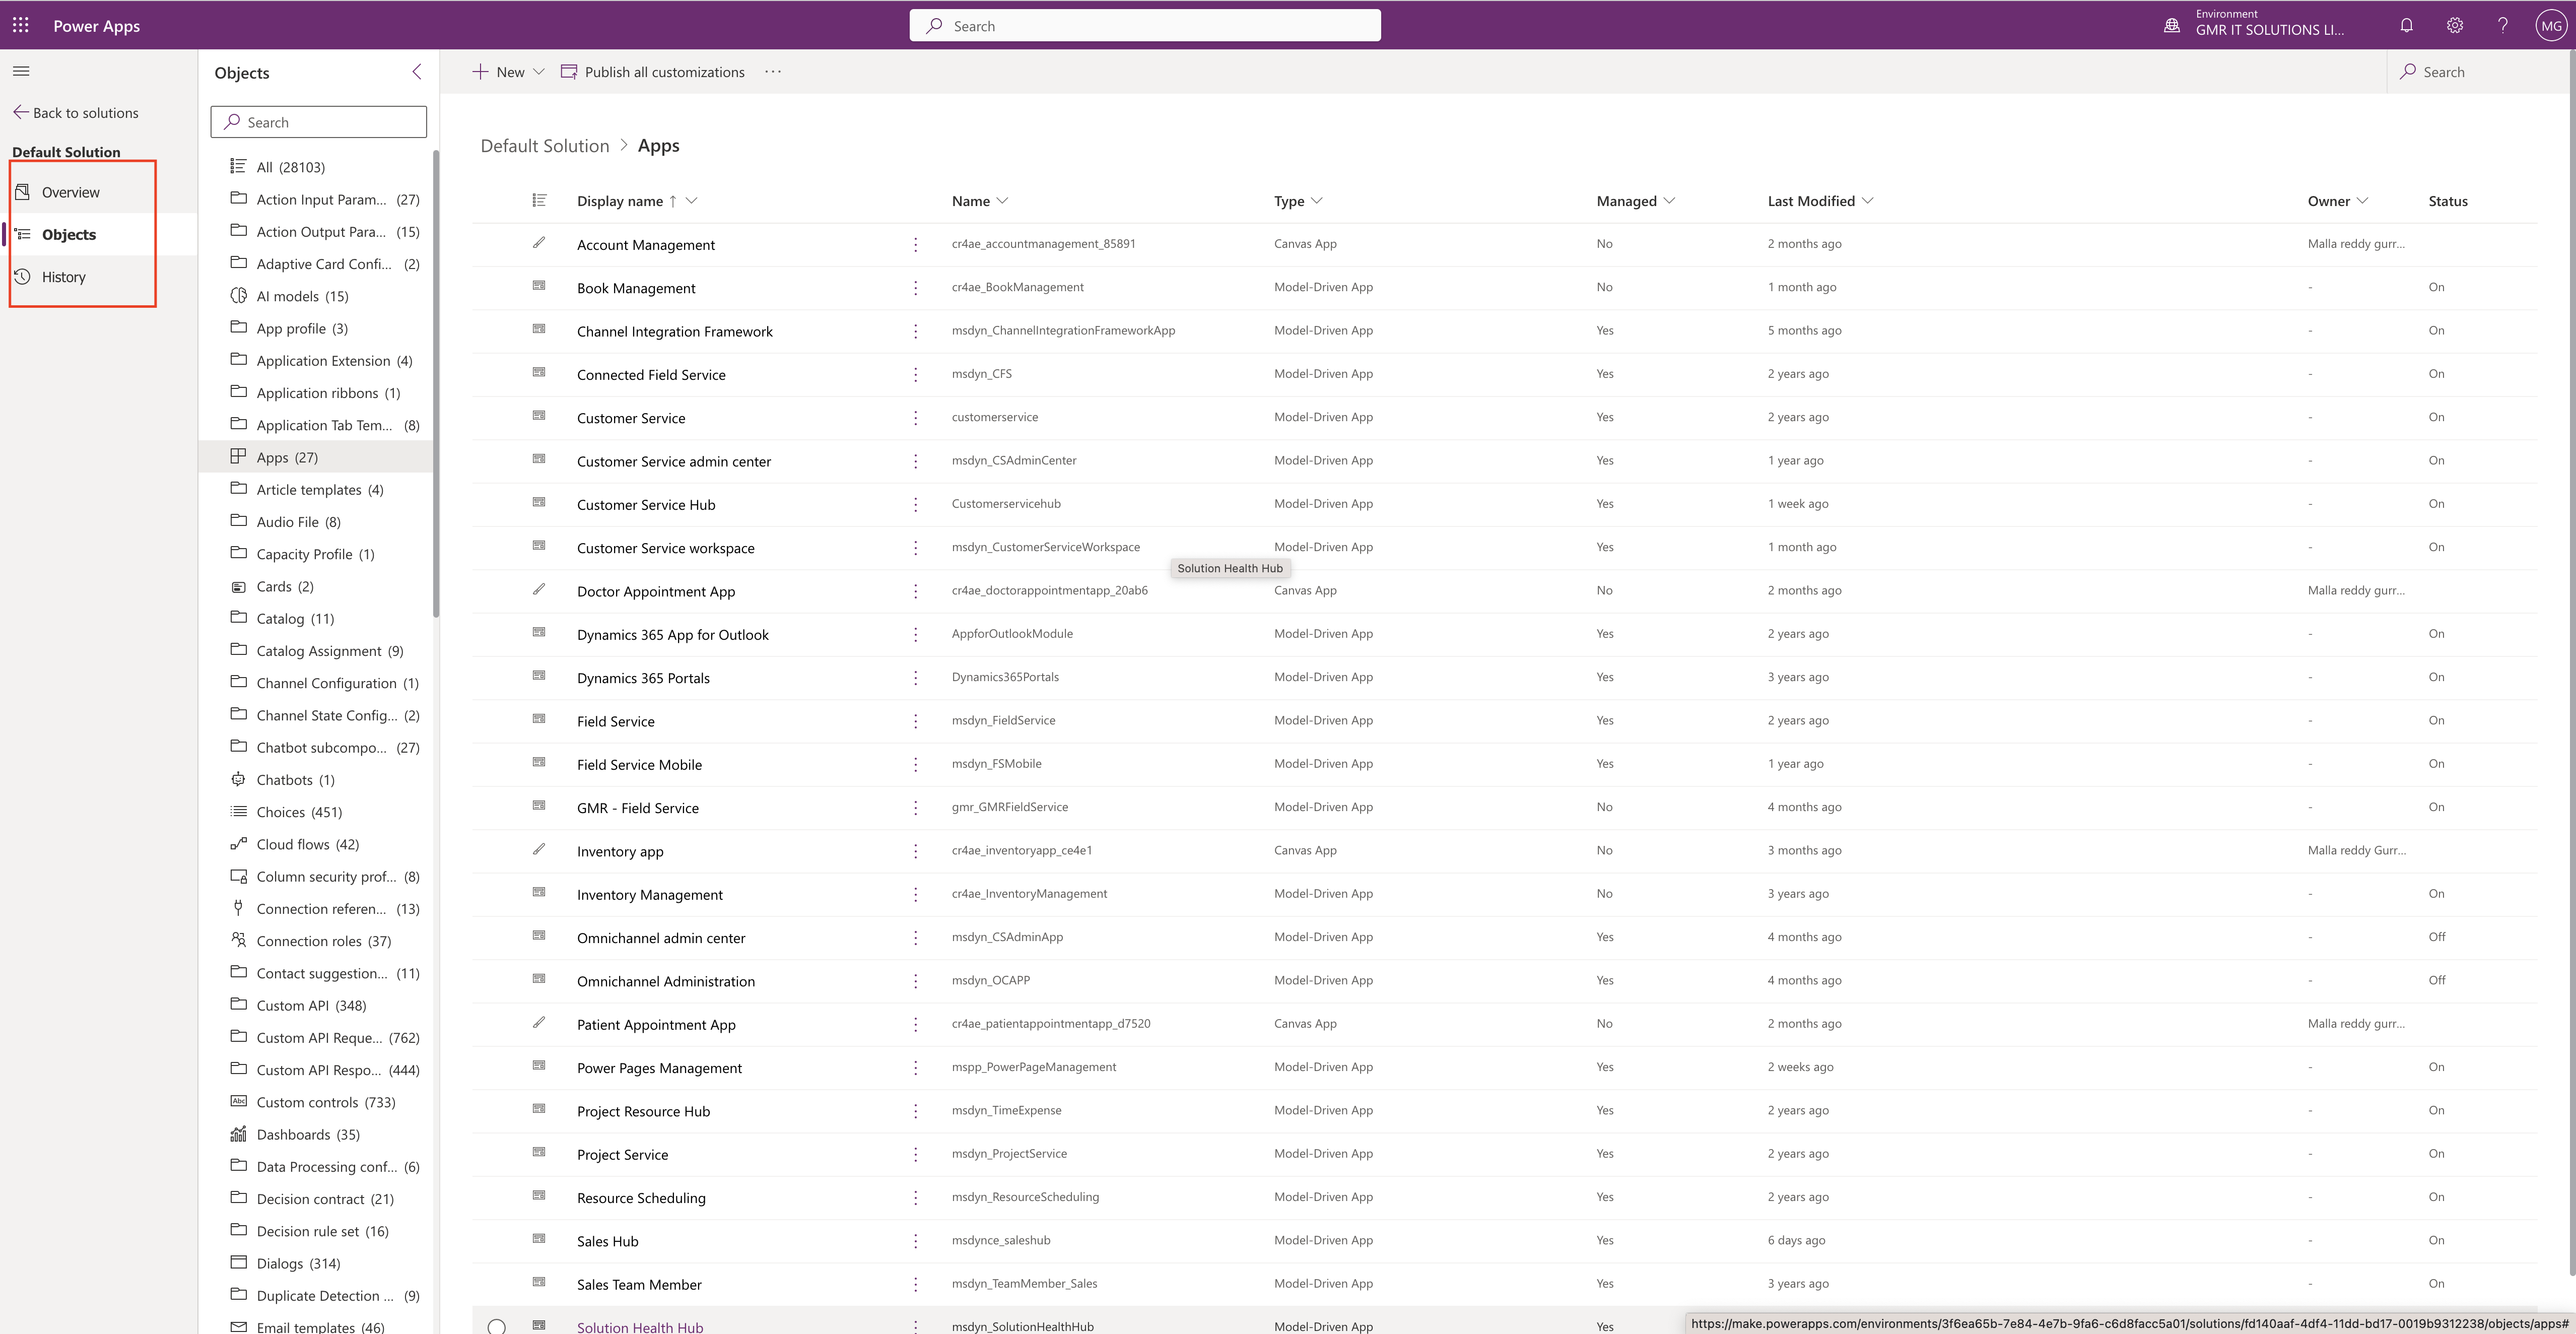
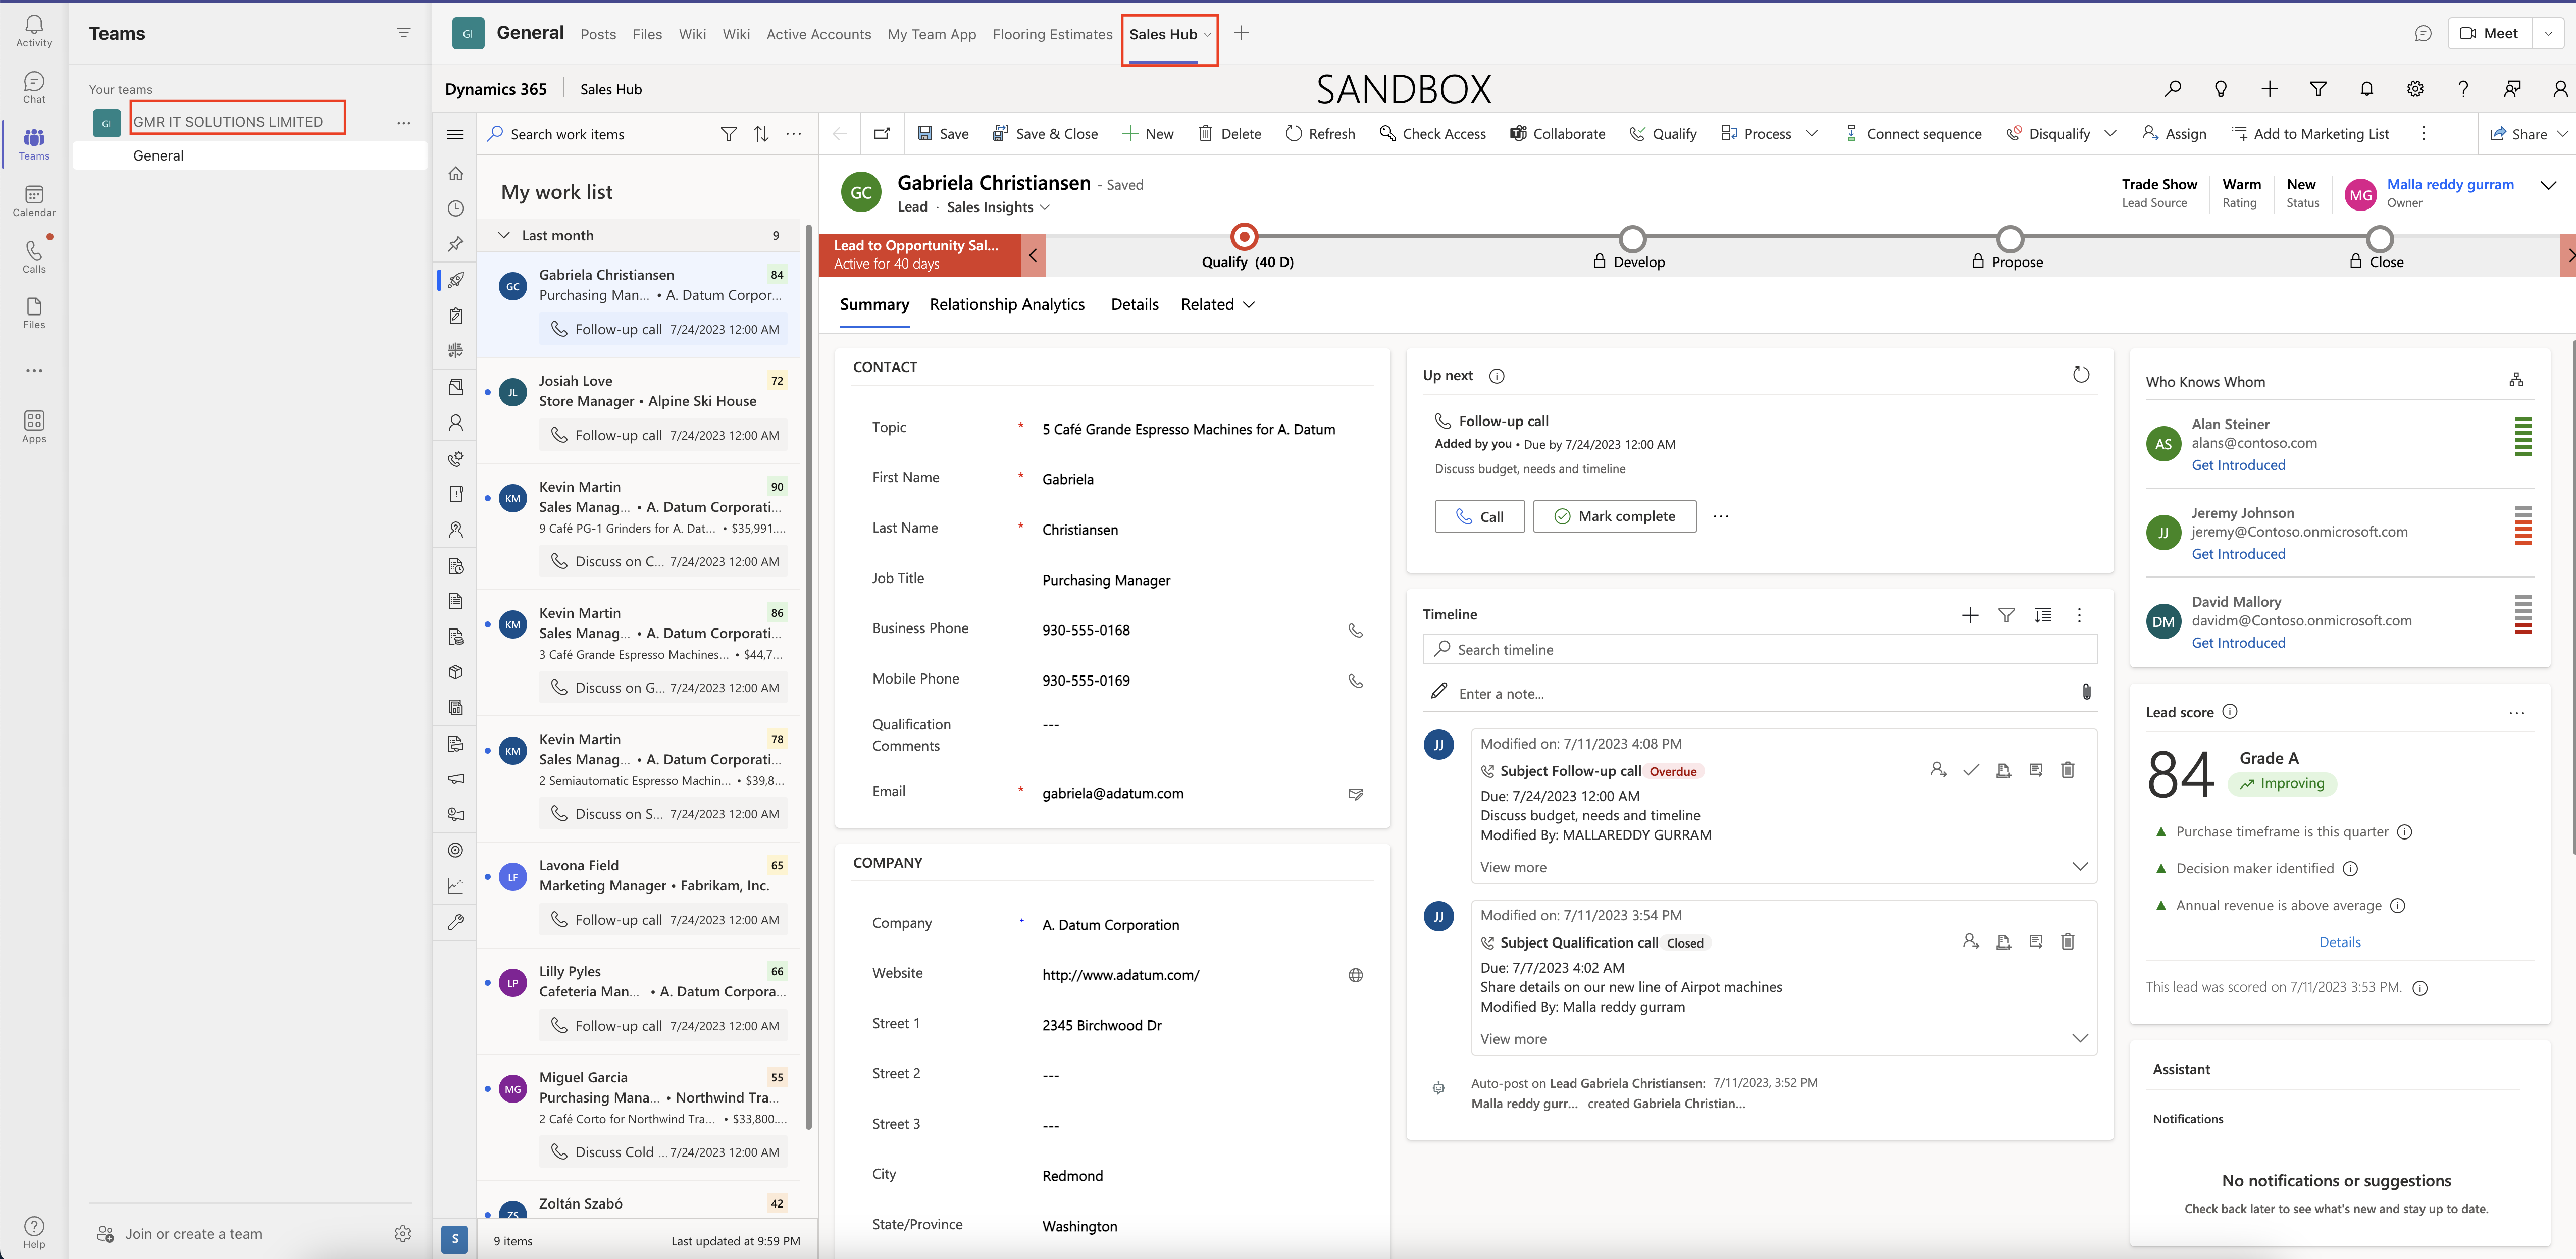
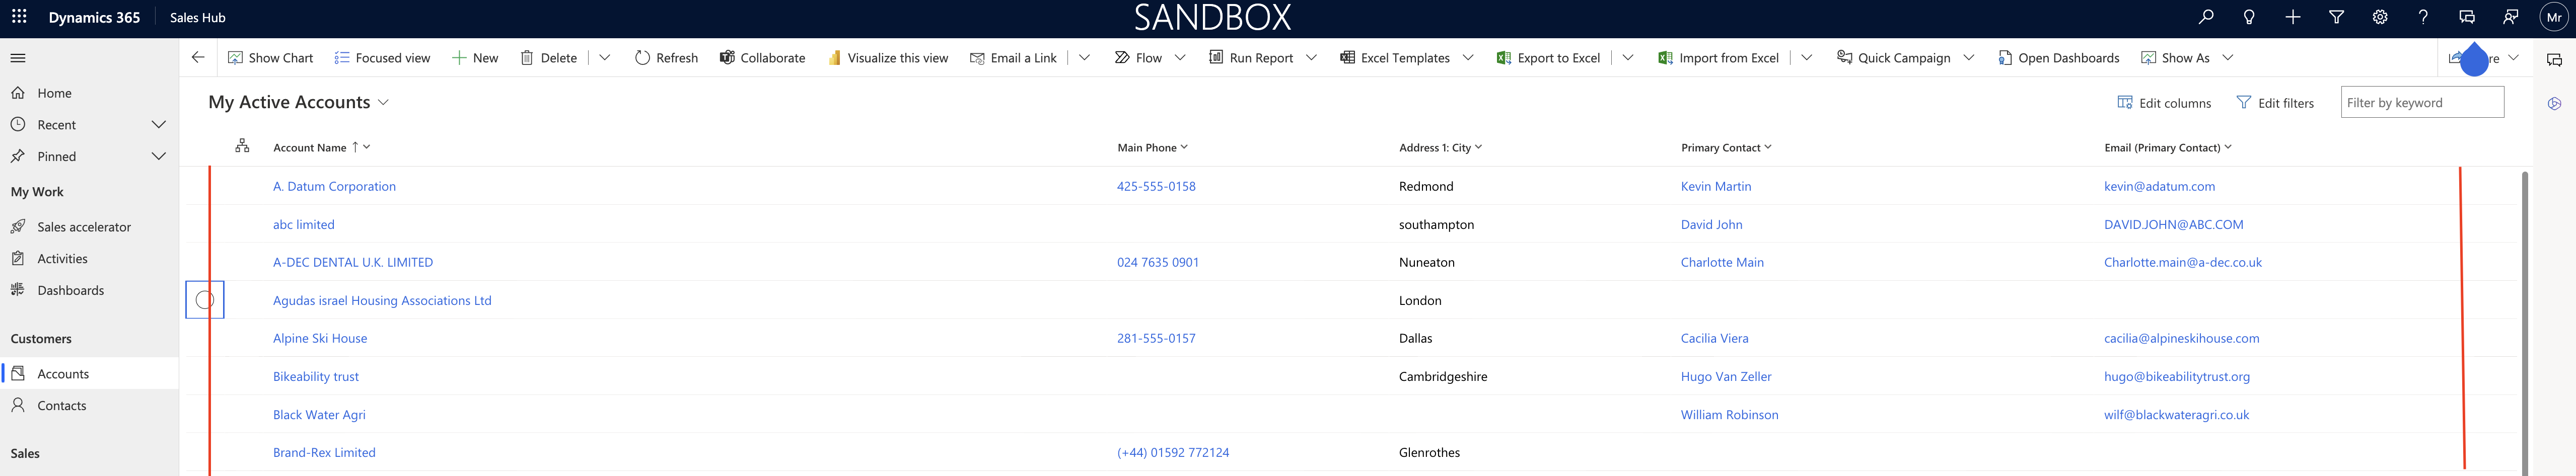
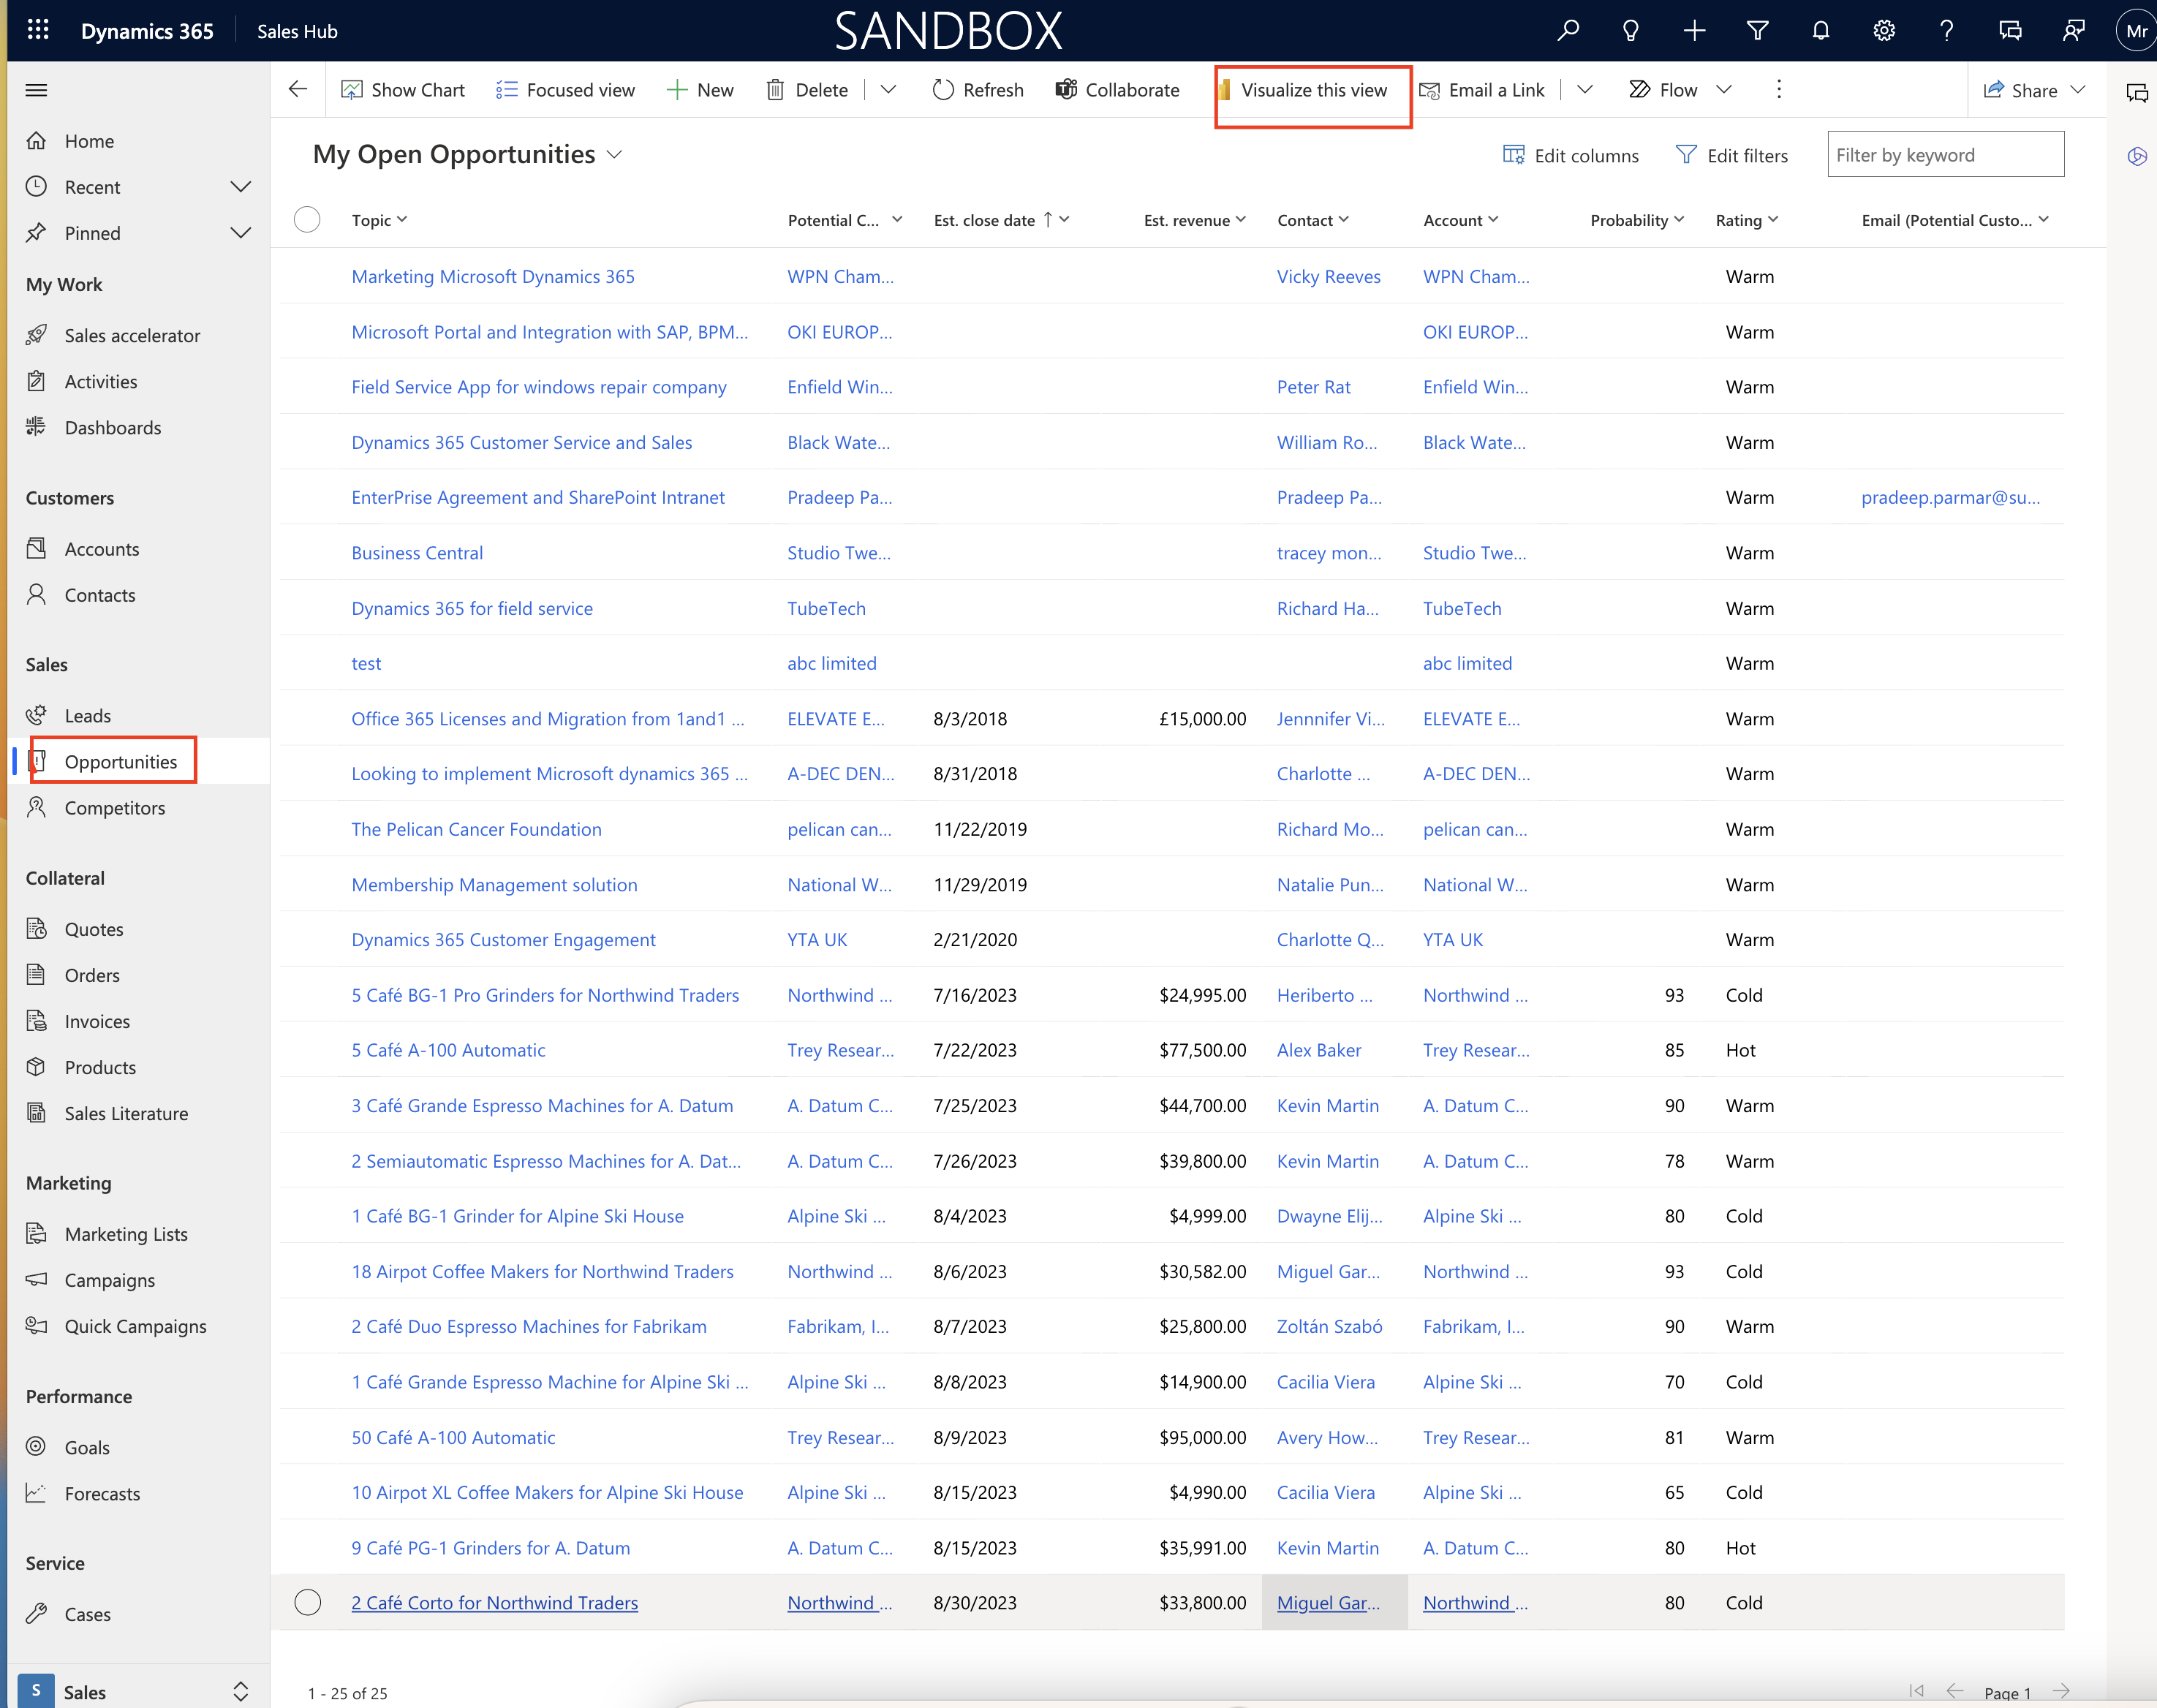
In your model-driven Power App or Dynamics 365 app, select the Visualize this view button in the app bar of any grid view.

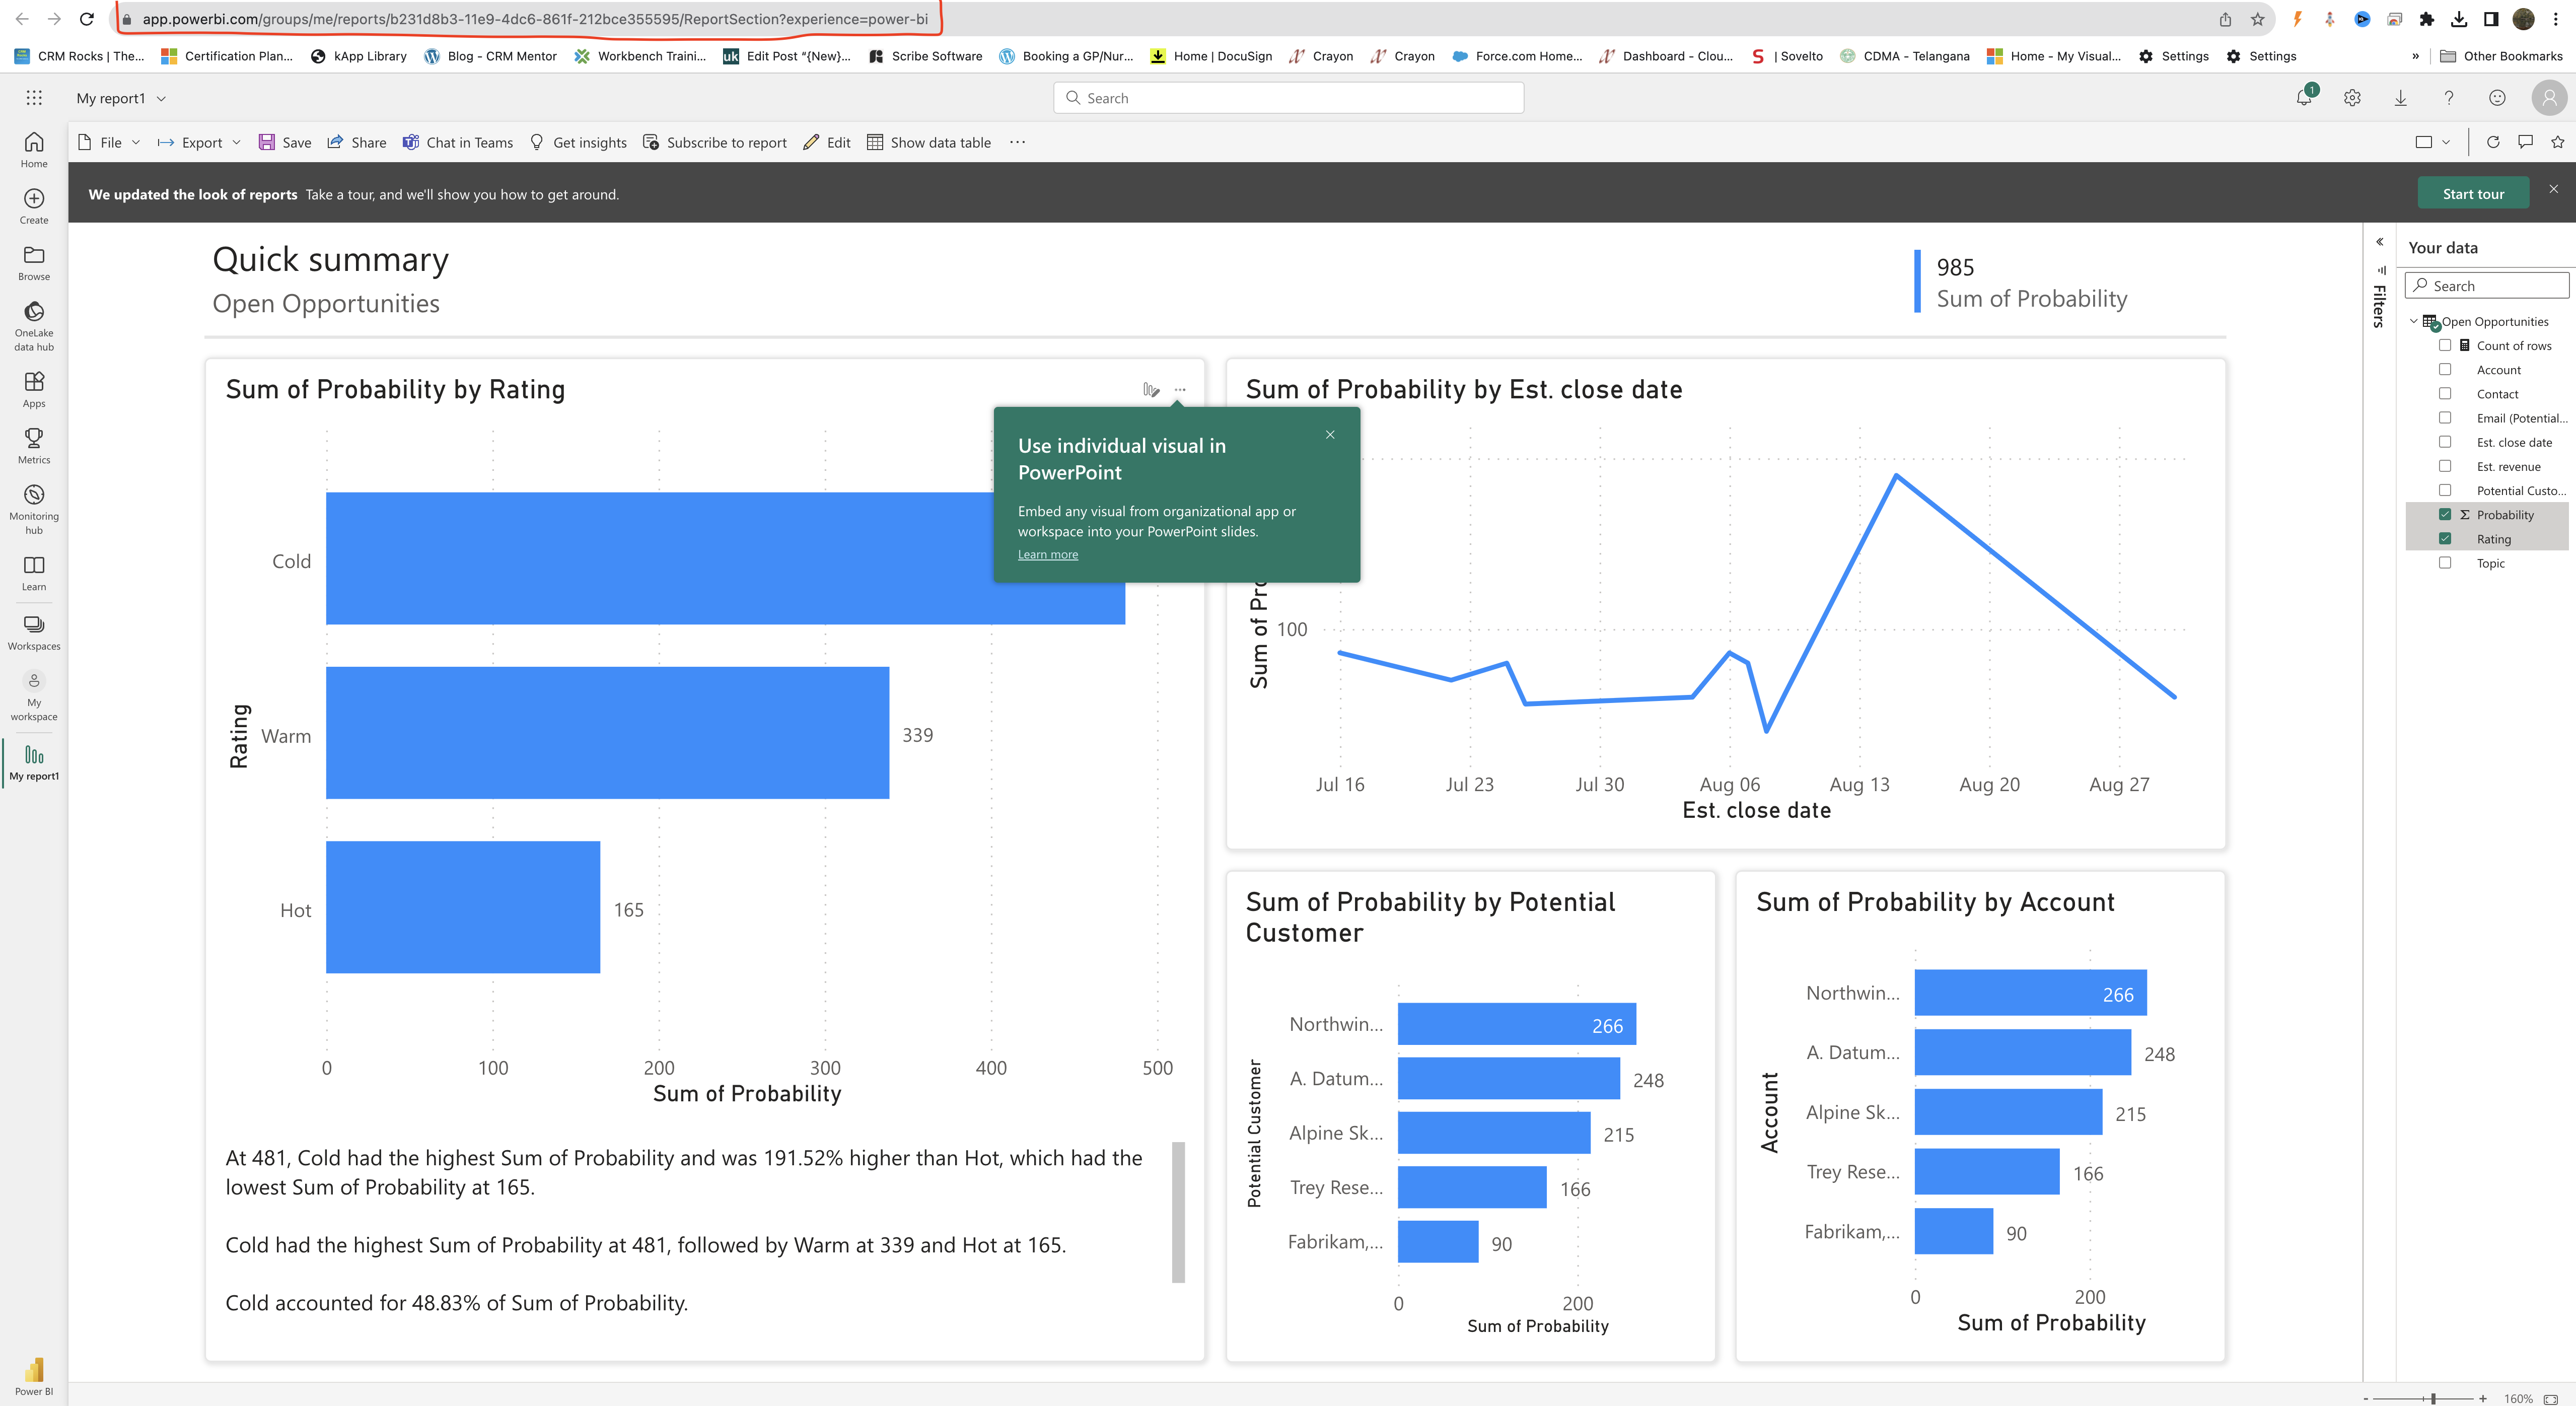
As soon as you click on the Visualize this view new popup with report will be displayed. Whatever the fields on the view will be displayed in the report.

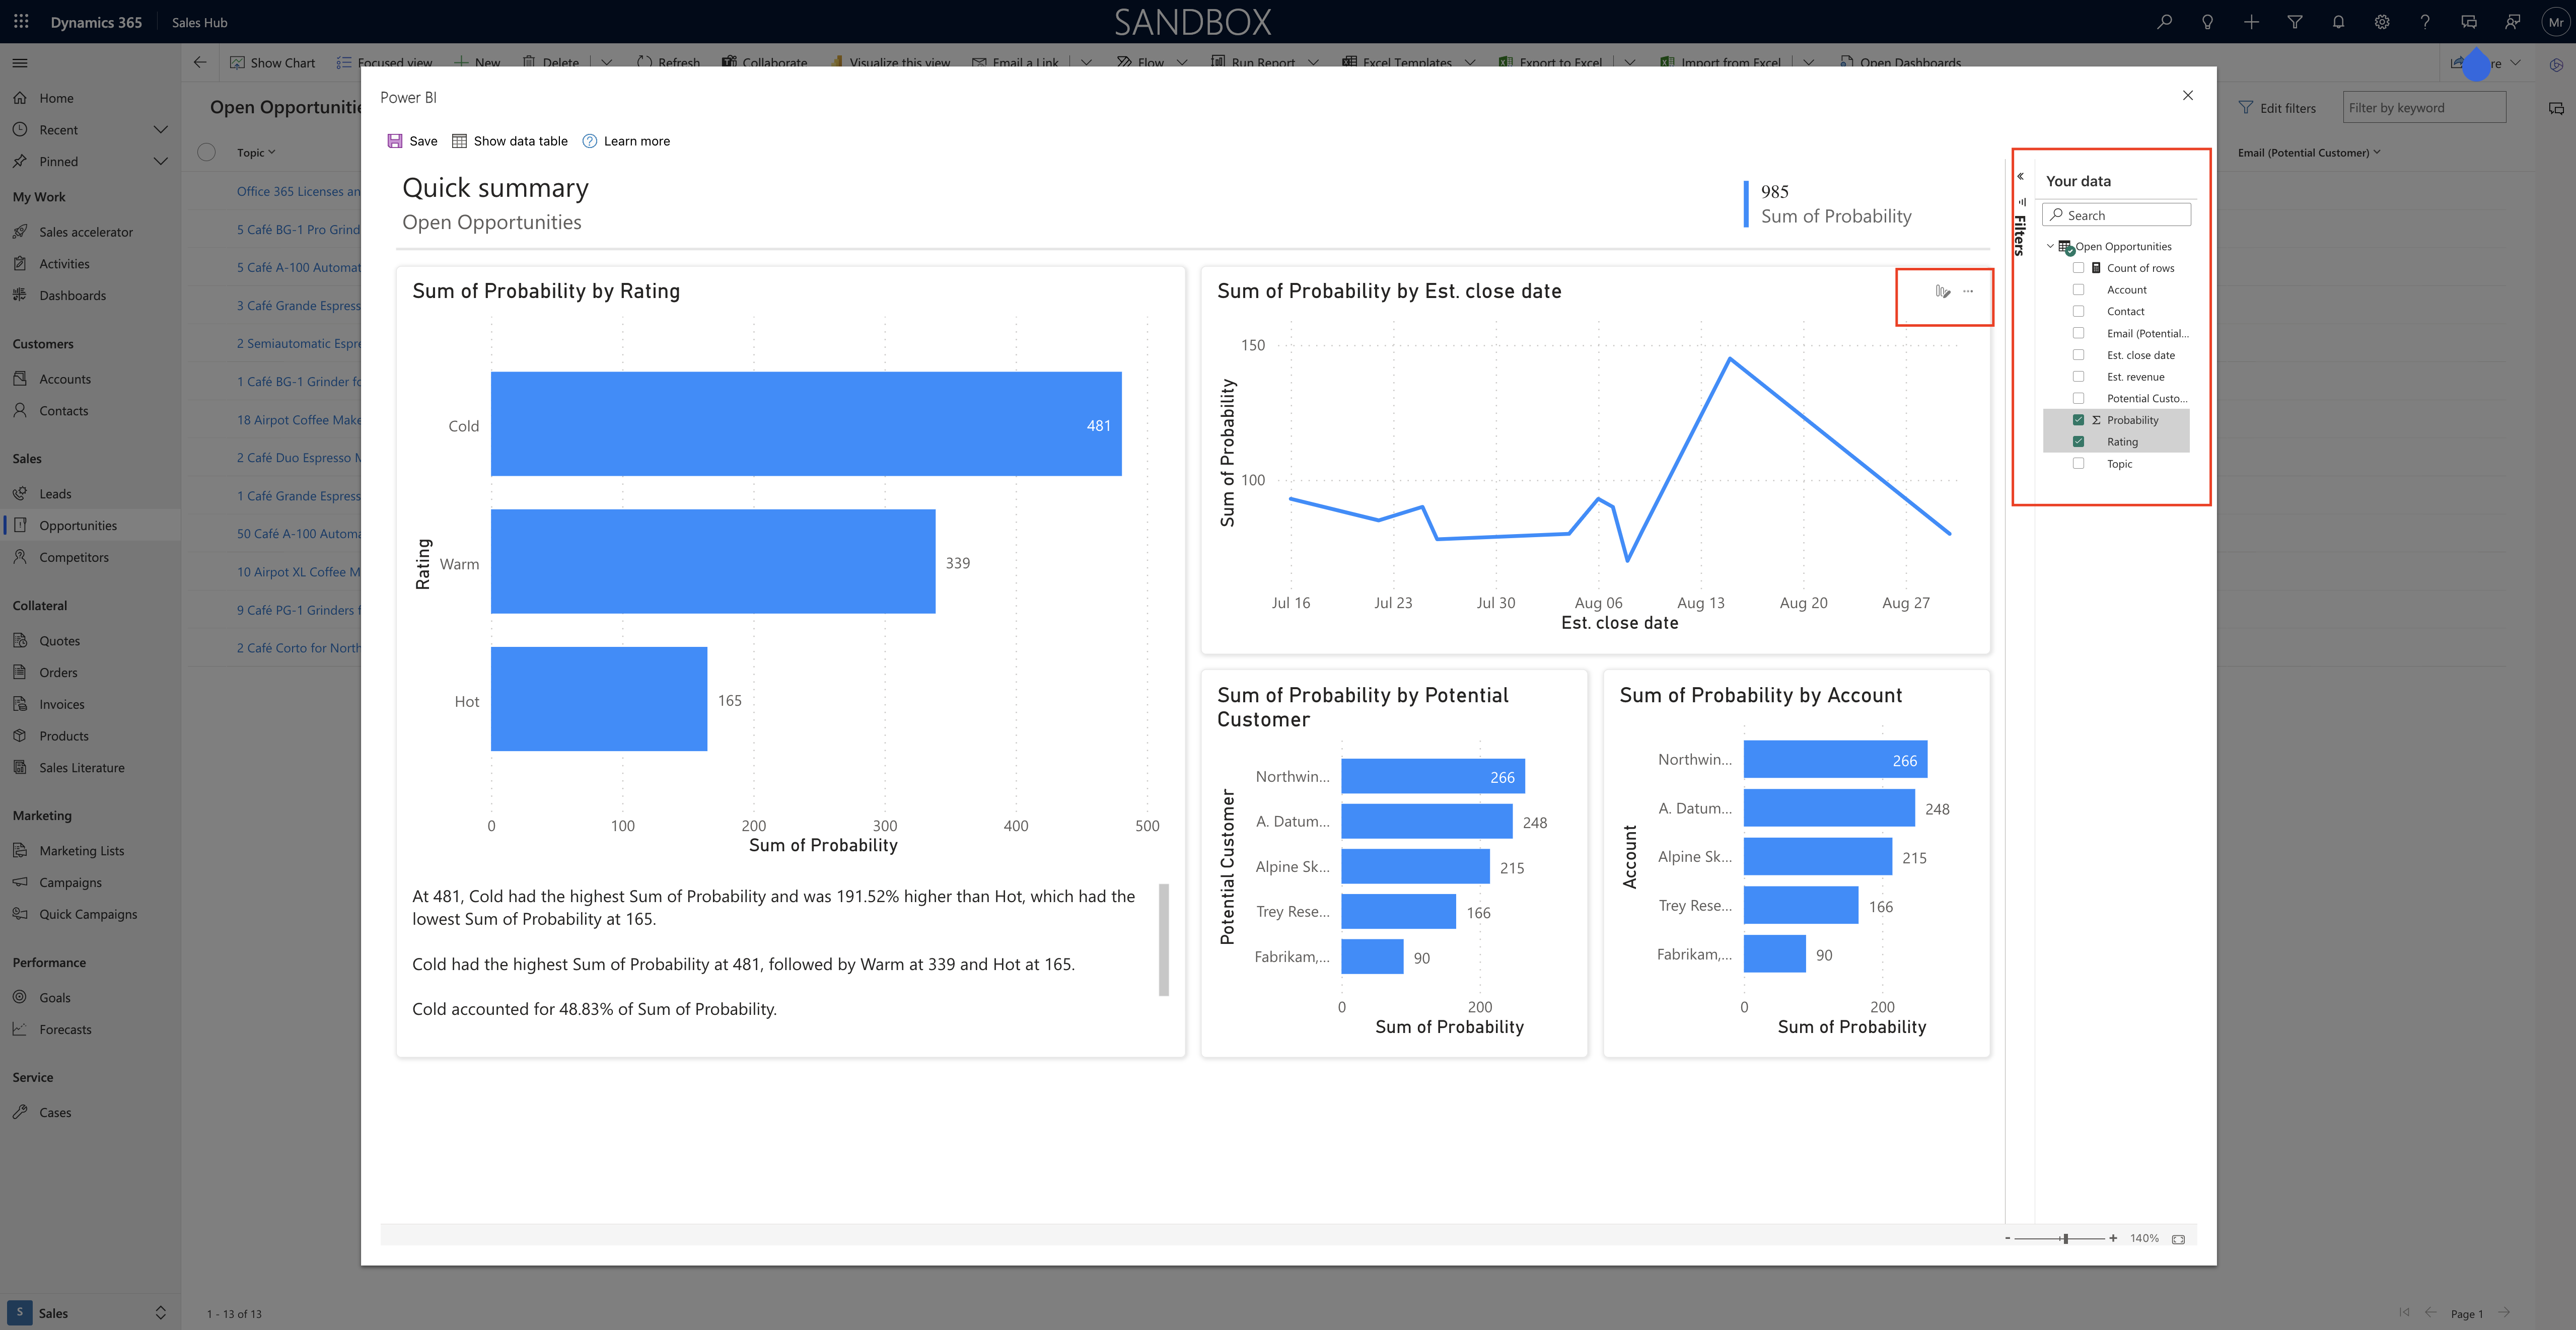
You can change the data in “Your data” pane and or remove fields that you’re interested in visualizing. Power BI automatically adds or removes charts to show new visuals.

You can also filter the orginal view and select the “Visualize this view” then those fields which are in the view will be displayed as part of the report.

This makes it very easy to iteratively explore your data, jumping back and forth between filtering in the grid and visualizing with Power BI, until you find the insights you are looking for.

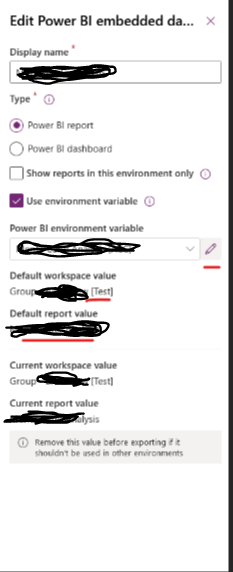
Save the report and dataset:

Once you have completed the exploring with your data, just save the changes on the SAVE Button on the report.

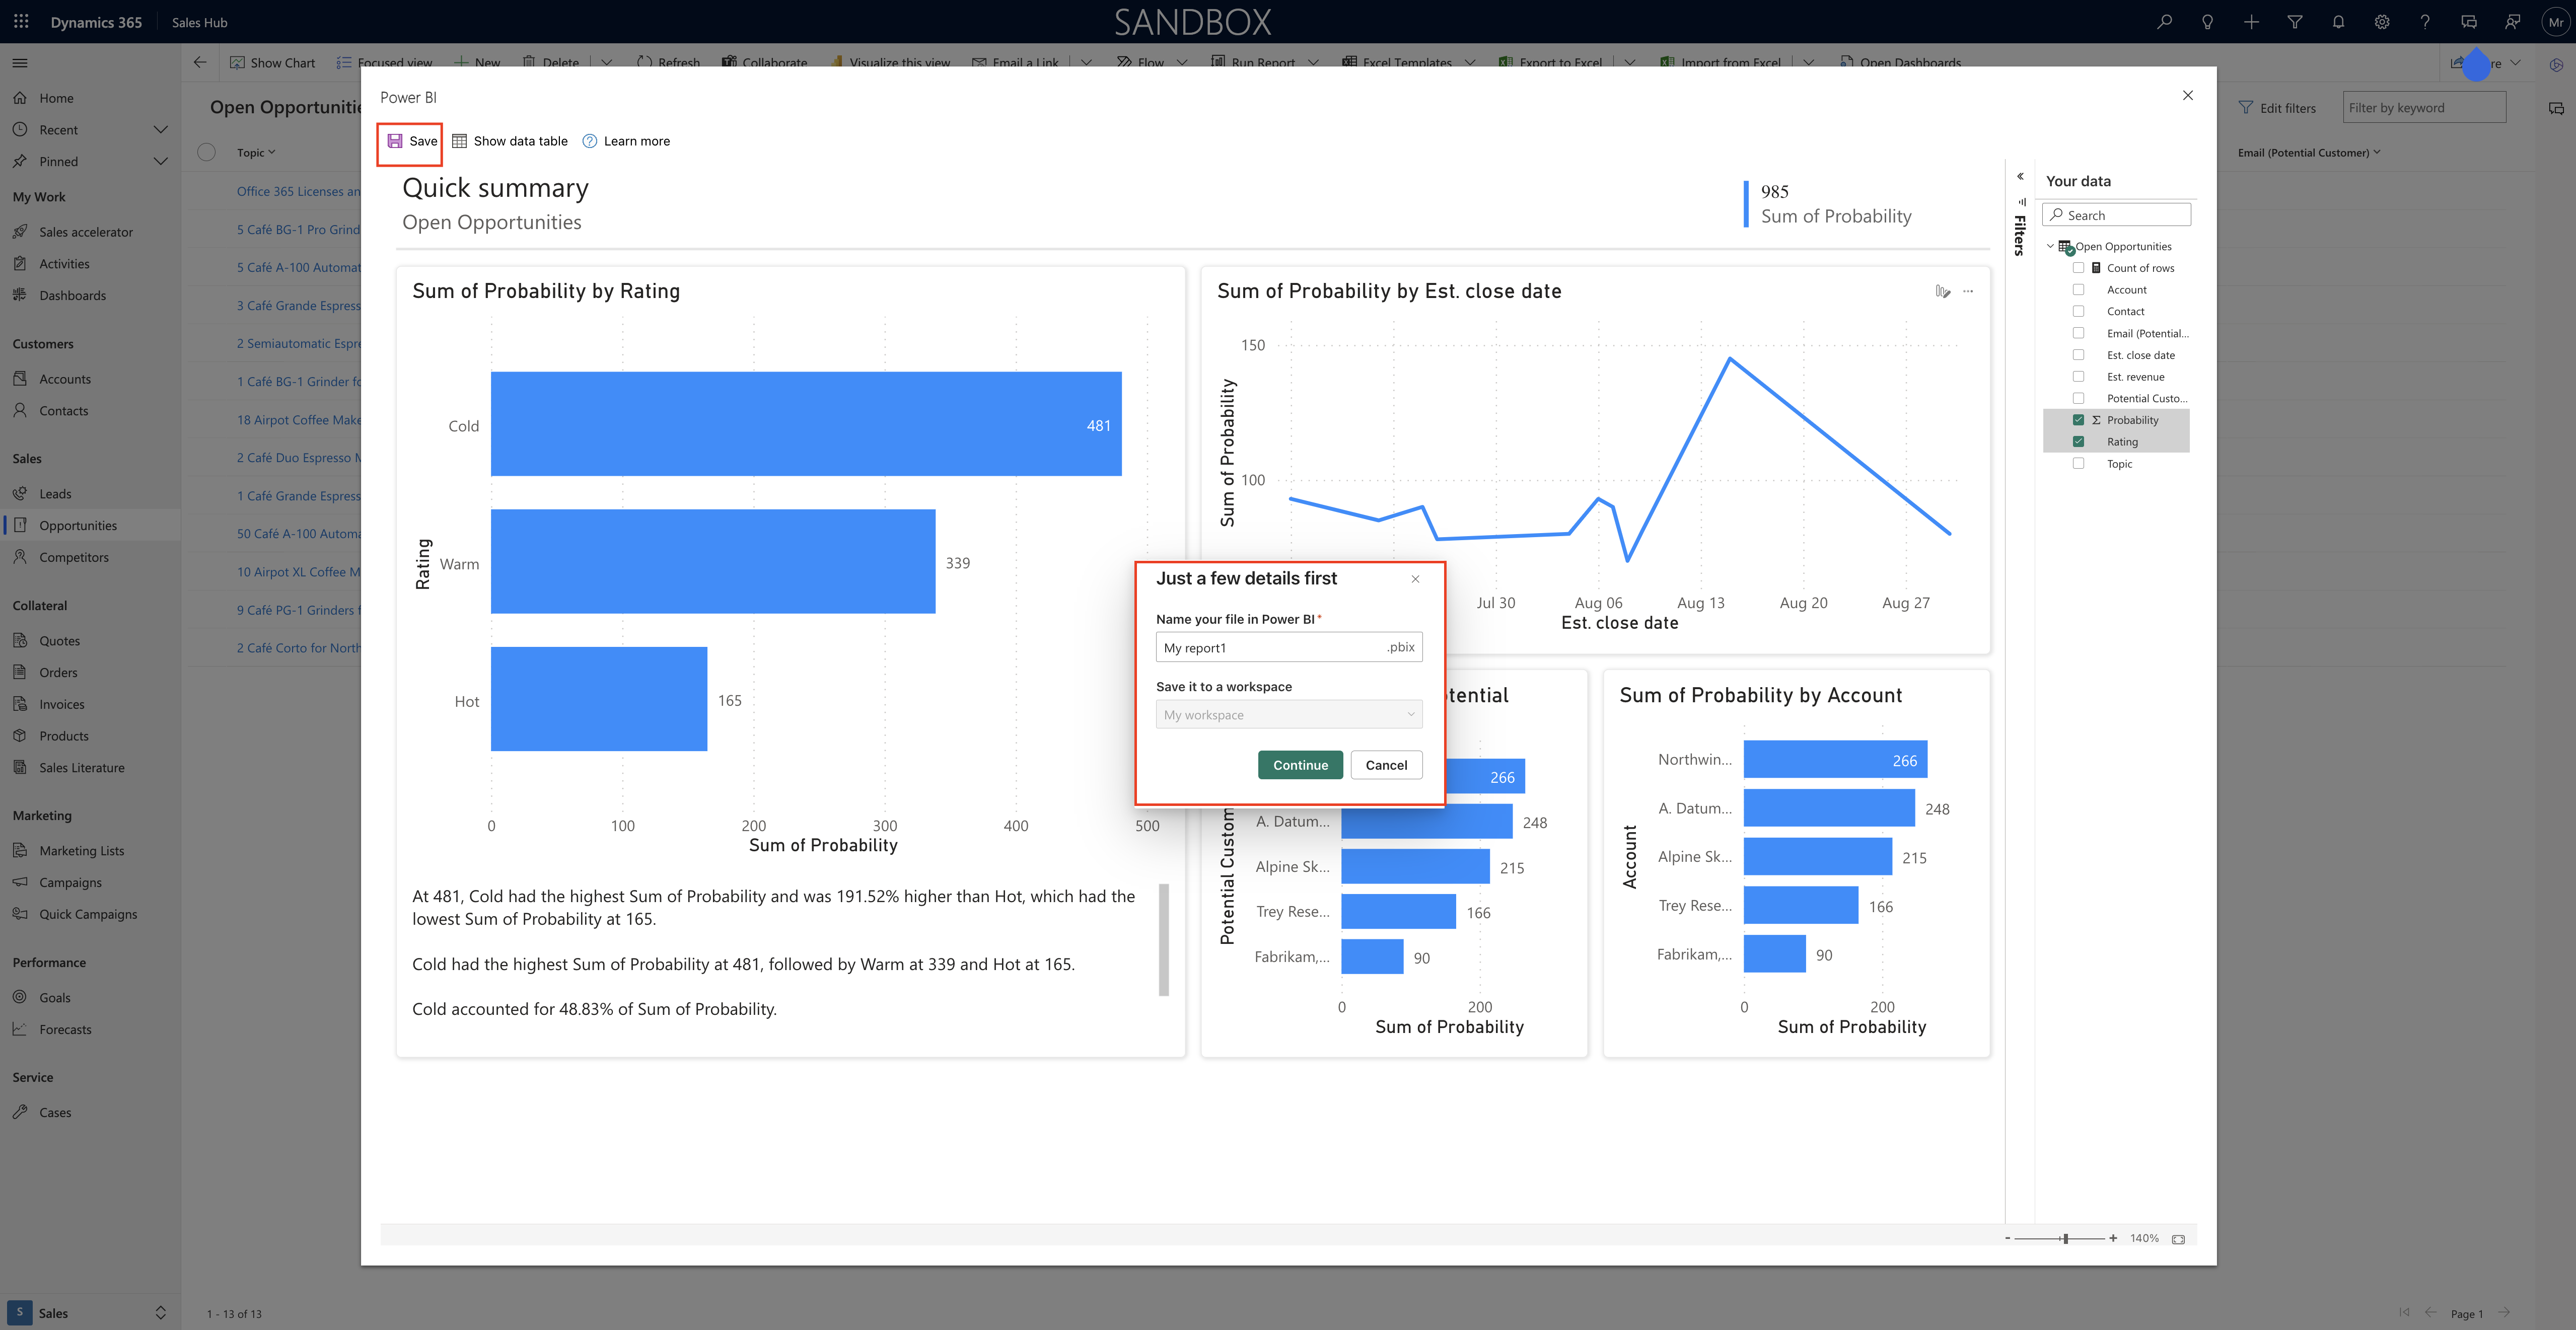
After saving a new report will be saved on your Power BI workspace and when you click on the saved report a new window will be opened with the Power BI report, you can always refer back to this report for your business needs.

1. You can share the report.

2. Package it in an app

3. Subscribe to email updates

4. Even download the.pbix to make further modifications.

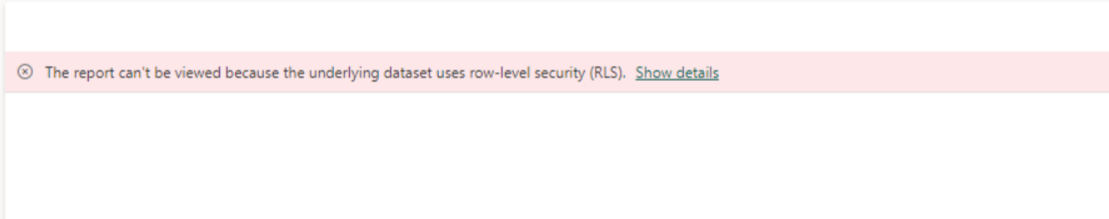
The datasets that gets saved through this flow is automatically configured as DirectQuery with Single sign-on(SSO) enabled.

So it is always up to date and respect Dataverse security settings.

If you already have Power BI credentials configured for the specific Dataverse Environment you are connecting to, and it isn’t set to SSO, we don’t automatically override this. we ask you to decide how you want to handle your credentials.

You can choose to either keep what’s already stored in Power BI or override it to use SSO. If you decide to keep what’s already in Power BI, your report may show different data when you view it in the Power BI Service. If you decide to override, this also updates your existing datasets connected to the same source.

Limitations:

1. You can see more fields in the report than you see in the original view, so those extra fields come from foreign keys for the columns or hierarchy, or URL fields that are being used within the original view for purpose other than columns.

2. The report created are temporary unless it is saved. also it only last for an 1 hour as it time out after set amount of time.

3. You can download the report you have created and Power BI uses single sign on and Direct Query for the autogenerated report.

So the data you can download is only the data you have permission to see in Dynamics. You cannot access data that you normally wouldn’t be able to see.

Power BI admins can restrict download to excel on the Power BI side by managing in the Power BI admin portal.

That’s it for today.

I hope this helps.
Malla Reddy Gurram(@UK365GUY)
#365BlogPostsin365Days

Share this:

{How to} add Power Apps grid control to views for an table

Hello Everyone,

Today I am going to share how to add Power Apps grid control to views for an table.

Let’s get’s started.

What is Power Apps grid control?

It allows Power Apps read-only grid control, allowing users to view, open and edit records from views and subgrids.

Also allow inline editing, the conrol provides other capabilities including a modern data browsing experience via infinite scrolling, allowing users to scroll indefinitely through data until they find the records they’re interested in, and an ability to customize the visual appearance of columns for specific needs.

Like the read-only grid control, this control supports the latest Microsoft accessibilty standarda and aligns with the latest Microsoft design guidance.

Note: This control will eventually replace all read only and editable grids in model driven apps.

How to enable Power Apps grid control to views for an entity?

1.Go to the solution explorer and open the entity you want and select it.

2. On the control tab, select Add control

3. In the Add control dialog box, select the Power Apps grid control and then select Add.

Configure the Power Apps grid control by selecting for web or phone or tablets then this makes the control default control for the selected clients.

Then save and publish the changes.

Go back to the account record and see the grid view.

That’s it for today.

I hope this helps.
Malla Reddy Gurram(@UK365GUY)
#365BlogPostsin365Days

Share this:

Show other people when they’re using the same form on Power Apps Model Driven Apps

Hello Everyone,

Today i am going to show how to enable and Show other people when they’re using the same form in Model Driven Apps.

Let’s get’s started.

Firstly how to enable this feature:

Login into www.admin.powerplatform.microsoft.com

Go to settings > collabarations > turn on Show other people when they are using same form(see below screenshot)

Suppose you are using the case record and your co-worker is working on same record, then you can see other users who are working in the same record as well as select a user picture to see their online status, send them an email or start a teams chat too.

Note: This feature uses Azure Fluid Relay Service Availability, so you must have this feature available in your region if you want to try this feature.

Also users must be able to access fluidrelay.azure.com

You can also see the user’s status and picture: App users for example record owner as well as the users appearing in grids and lookups are displayed with their picture and online status.

Note: Available in Model Driven Apps and cannot be disabeld, extended to user lookups and grid user columns.

Share Privilege on a record and you email a record link to a colleague, the colleague will automatically get read access to the record.

That’s it for today.

I hope this helps
Malla Reddy Gurram(@UK365GUY)
#365BlogPostsin365Days

Share this: